

|
|
|
|

Contacts:
Scott Scheleur Survey Processing (301) 457-2713 (Census)
For Release 10:00 A.M. EDT
Carol
King Survey Methodology (301) 457-2675 (Census)
Friday, November 22, 2002
Electronic
inquiries:
[email protected] CB-02-147
RETAIL E-COMMERCE SALES IN SECOND QUARTER 2002 WERE $10.2 BILLION, UP 24.2 PERCENT
FROM SECOND QUARTER 2001, CENSUS BUREAU REPORTS
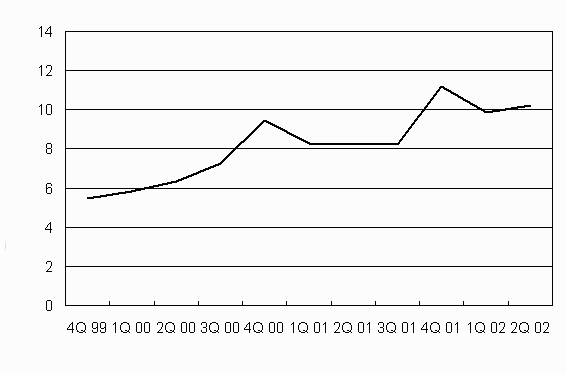
The Census Bureau of the Department of Commerce announced today that the estimate of U.S. retail e-commerce sales for the second quarter of 2002, not adjusted for seasonal, holiday, and trading-day differences, was $10.243 billion, an increase of 24.2 percent (±5.5%) from the second quarter of 2001. Total retail sales for the second quarter of 2002 were estimated at $825.5 billion, an increase of 2.5 percent (±0.4%) from the same period a year ago.
The second quarter 2002 e-commerce estimate increased 3.7 percent (±1.4%) from the first quarter of 2002 while total retail sales increased 11.0 percent (±0.3%) from the prior quarter.
E-commerce sales in the second quarter of 2002 accounted for 1.2 percent of total sales, while in the second quarter of 2001 e-commerce sales were 1.0 percent of total sales. In the first quarter of 2002 e-commerce sales were 1.3 percent of total sales.
Estimated Quarterly U.S. Retail E-commerce Sales:
4th Quarter 1999 – 2nd Quarter 2002
(Data not adjusted for seasonal, holiday and trading-day differences)
The retail e-commerce sales estimate for the fourth quarter of 2002 is scheduled for release in February 2003.
E-commerce retail sales data and frequently asked questions (FAQ’s) about e-commerce sales are available on the Census website at www.census.gov/mrts/www/mrts.html. For additional information about Census Bureau e-business measurement programs and plans visit www.census.gov/estats.
Table 1.Estimated Quarterly U.S. Retail Sales1: Total and E-commerce
(Data in millions of dollars, not adjusted for seasonal, holiday and trading-day differences.)
|
Period |
Retail Sales1 |
E-commerce as a Percent of Total Sales |
Quarter-to-Quarter Percent Change |
Year-to-Year Percent Change |
|||
|
Total |
E-commerce2 |
Total Sales |
E-commerce Sales |
Total Sales |
E-commerce Sales |
||
|
1999 4th Quarter |
784,278 |
5,481 |
0.7 |
8.1 |
(NA) |
9.1 |
(NA) |
|
2000 1st Quarter |
711,600 |
5,814 |
0.8 |
-9.3 |
6.1 |
11.2 |
(NA) |
|
2nd Quarter |
771,691 |
6,346 |
0.8 |
8.4 |
9.2 |
7.4 |
(NA) |
|
3rd Quarter |
765,536 |
7,266 |
0.9 |
-0.8 |
14.5 |
5.5 |
(NA) |
|
4th Quarter |
810,311 |
9,459 |
1.2 |
5.8 |
30.2 |
3.3 |
72.6 |
|
2001 1st Quarter |
724,224 |
8,256 |
1.1 |
-10.6 |
-12.7 |
1.8 |
42.0 |
|
2ndQuarter |
805,245 |
8,246 |
1.0 |
11.2 |
-0.1 |
4.3 |
29.9 |
|
3rd Quarter |
782,088 |
8,236 |
1.1 |
-2.9 |
-0.1 |
2.2 |
13.3 |
|
4th Quarter r |
856,285 |
11,178 |
1.3 |
9.5 |
35.7 |
5.7 |
18.2 |
|
2002 1st Quarter r |
743,810 |
9,880 |
1.3 |
-13.1 |
-11.6 |
2.7 |
19.7 |
|
2st Quarter p |
825,532 |
10,243 |
1.2 |
11.0 |
3.7 |
2.5 |
24.2 |
NA Not available. r Revised. p Preliminary.
1 Does not include Food Services.
2 E-commerce sales are sales of goods and services where an order is placed by the buyer or price and terms of sale are negotiated over an Internet, extranet, Electronic Data Interchange (EDI) network, electronic mail, or other online system. Payment may or may not be made online.
Explanatory Notes
Retail e-commerce sales are estimated from the same sample used in the Monthly Retail Trade Survey (MRTS) to estimate preliminary and final U.S. retail sales. Advance U.S. retail sales are estimated from a subsample of the MRTS sample that is not of adequate size to measure changes in retail e-commerce sales.
A stratified simple random sampling method is used to select approximately 11,000 retail firms whose sales are then weighted and benchmarked to represent the complete universe of over two million retail firms. The MRTS sample is probability based and represents all employer firms engaged in retail activities as defined by the North American Industry Classification System (NAICS). Coverage includes all retailers whether or not they are engaged in e-commerce. Online travel services, financial brokers and dealers, and ticket sales agencies are not classified as retail and are not included in either the total retail or retail e-commerce sales estimates. Nonemployers are represented in the estimates through the benchmarking operation. E-commerce sales are included in the total monthly sales estimates.
The MRTS sample is updated on an ongoing basis to account for new retail employer businesses (including those selling via the Internet), business deaths, and other changes to the retail business universe. Research was conducted to ensure that retail firms selected in the MRTS sample and engaged in e-commerce are representative of the universe of e-commerce retailers.
Firms are asked each month to report e-commerce sales separately. For each month of the quarter, data for nonresponding sampling units are imputed from responding sampling units falling within the same kind of business and sales size category. Approximately 16.0 percent of the e-commerce sales estimate for second quarter 2002 was imputed. Imputed total retail sales data accounted for approximately 19 percent of the estimate of U.S. retail sales for the second quarter 2002.
For each month of the quarter, estimates are obtained by summing weighted sales (either reported or imputed). The monthly estimates are benchmarked to prior annual survey estimates. Estimates for the quarter are obtained by summing the monthly benchmarked estimates. For second quarter 2002, the estimate for June is a preliminary estimate. Therefore, the estimate is subject to revision.
Reliability of Estimates
The margin of error for the change in U.S. retail e-commerce sales from the first quarter 2002 to the second quarter 2002 is approximately 1.4%, giving a range of 2.2% to 5.1%. Range estimates are computed based on the particular sample selected and canvassed. If we had repeated the process of drawing all possible samples and forming all corresponding range estimates, approximately 90 percent of these individual range estimates would have contained the quarter-to-quarter change in e-commerce sales computed from a complete enumeration of all retail firms on the sampling frame. Because the range above does not contain 0%, we can conclude at the 90 percent confidence level that retail e-commerce sales increased from the first quarter 2002 to the second quarter 2002.
Table 2.Range Estimates for Estimated Dollar Volumes
(Data in millions of dollars)
|
Period |
Retail Sales |
Retail E-commerce Sales |
||
|
Lower Bound |
Upper Bound |
Lower Bound |
Upper Bound |
|
|
1999 4th Quarter |
778,302 |
790,254 |
5,208 |
5,754 |
|
2000 1st Quarter |
705,397 |
717,803 |
5,430 |
6,198 |
|
2nd Quarter |
765,202 |
778,180 |
5,975 |
6,717 |
|
3rd Quarter |
758,521 |
772,551 |
6,850 |
7,682 |
|
4th Quarter |
802,980 |
817,642 |
8,958 |
9,960 |
|
2001 1st Quarter |
716,480 |
731,968 |
7,796 |
8,716 |
|
2nd Quarter |
800,212 |
810,278 |
7,940 |
8,552 |
|
3rd Quarter |
776,187 |
787,990 |
7,903 |
8,569 |
|
4th Quarter |
850,041 |
862,529 |
10,808 |
11,548 |
|
2002 1st Quarter r |
738,426 |
749,194 |
9,539 |
10,221 |
|
2nd Quarter p |
819,014 |
832,050 |
9,788 |
10,698 |
r Revised. p Preliminary.
Note: Confidence intervals computed for estimates prior to those for the first quarter 2001 used the coefficients of variation estimated from the SIC-based sample.
Estimates in this report are based on a sample, and therefore, are subject to sampling and nonsampling error. A general discussion of the estimates and survey methodology appears in BR/01-A Current Business Reports and on the Internet: http://www.census.gov/mrts/www/mrts.html.
The U.S. Census Bureau, pre-eminent collector and disseminator of timely, relevant, and quality data about the people and the economy of the United States, conducts a population and housing census every 10 years, an economic census every five years, and more than 100 demographic and economic surveys every year, all of them evolving from the first census in 1790.
Source: Monthly Retail Surveys Branch,
U.S. Census Bureau
Last Revised: August 22, 2002
[an error occurred while processing this directive]