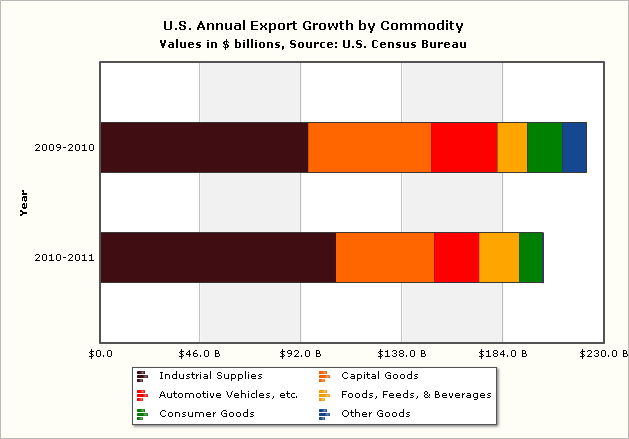
December's second graph plots the 2011 goods export growth of $202.4 billion by commodity. Industrial supplies and materials lead export growth in both 2010 and 2011. In 2011 exports of other petroleum products and fuel oil accounted for $41.1 billion of the increase in exports in this category. For more detail check out exhibit 7 of the December 2011 U.S. Interntional Trade in Goods and Services Report.