
end of header
Foreign Trade
[an error occurred while processing this directive]Foreign Trade › U.S. International Trade Data
Foreign Trade Graph of the Month - December 2011
Graph of the Month
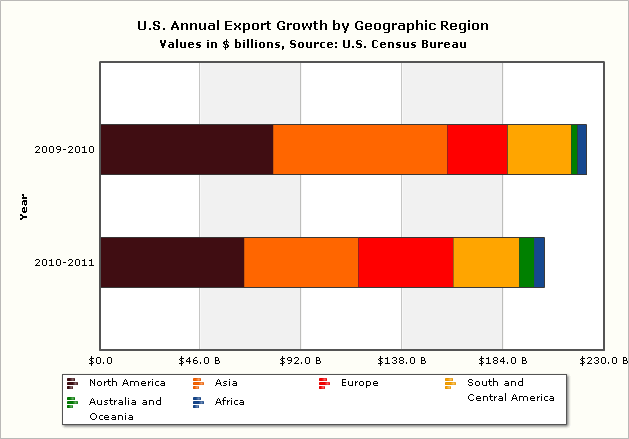
December's first graph plots the 2011 goods export growth of $202.4 billion by geographic region. 58% of the growth was accounted for by growth in exports to North America and Asia; just four countries: Mexico, Canada, China and Hong Kong, accounted for 46% of the growth. For more information on the top countries of export growth, see the Graph of the Month Archive
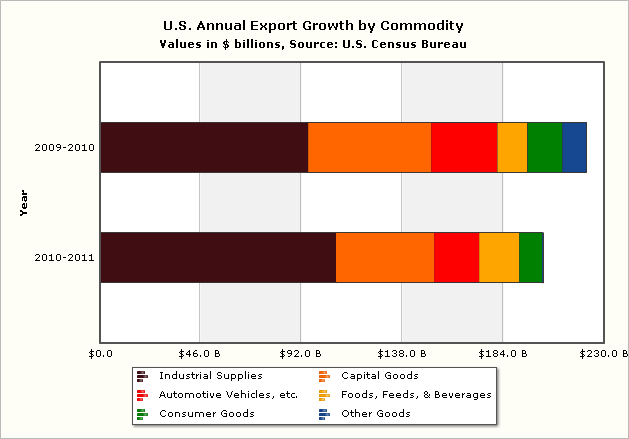
December's second graph plots the 2011 goods export growth of $202.4 billion by commodity. Industrial supplies and materials lead export growth in both 2010 and 2011. In 2011 exports of other petroleum products and fuel oil accounted for $41.1 billion of the increase in exports in this category. For more detail check out exhibit 7 of the December 2011 U.S. Interntional Trade in Goods and Services Report.